
Sprint and agility testing without timing gates.
Sprint timing from 5 to 30 m with every split, peak velocity, and video, six agility tests with automated turn verification, and stride analysis on every sprint. All from an iPhone on the sideline. No gates required.
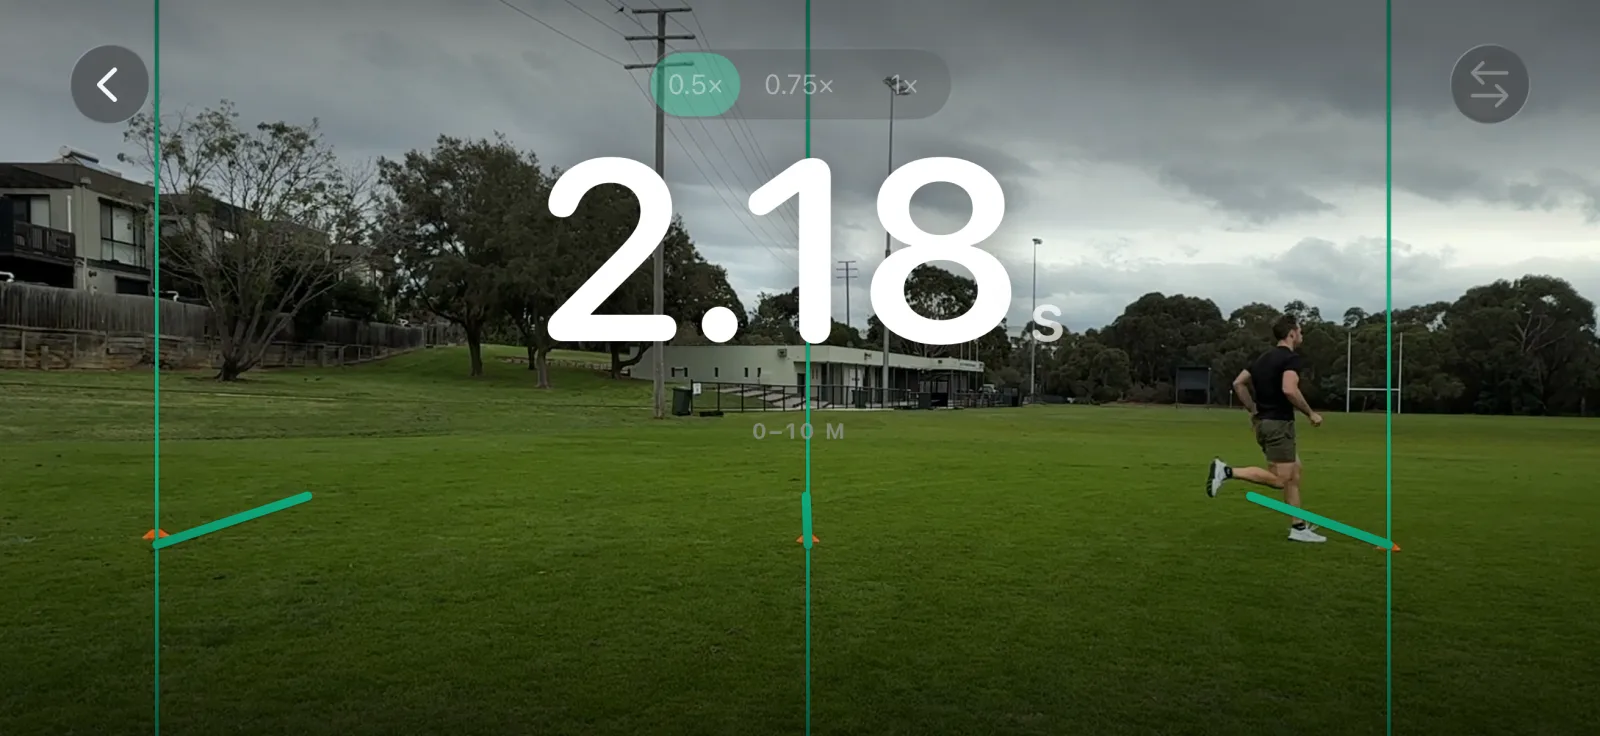
Fast setup with automated start detection
Measure out your track and place the virtual gates in the app. Arm the system and Metric Sprint locks onto your athlete as they approach the start line, then starts timing the moment they move.
How virtual gates work →Every split from 5 to 30 metres in one run
Pick 5, 10, 15, 20, or 30 m and tick the splits you want. A single recording returns the full acceleration profile, every split, and your flying 10 m, plotted as a curve. Gates give you a total. This shows you the shape of the run.
See the split breakdown → Peak velocity measured in every frame of the run
Timing gates can only average speed between two beams. Metric Sprint measures every frame, so it reports the highest velocity the athlete actually reached and where on the track they reached it. That is the number that separates an early accelerator from a genuine top-end sprinter.
How peak velocity is measured →Stride analytics and sprint mechanics on every sprint
Metric Sprint provides stride analytics on every sprint: ground contact time, flight time, stride length, and cadence. Go deeper still with mechanics: shin angle, thigh lift, trunk angle, and drive phase vs top speed analysis, automatically generated on every run. Delivered on device, instantly after each run.
Sprint analytics →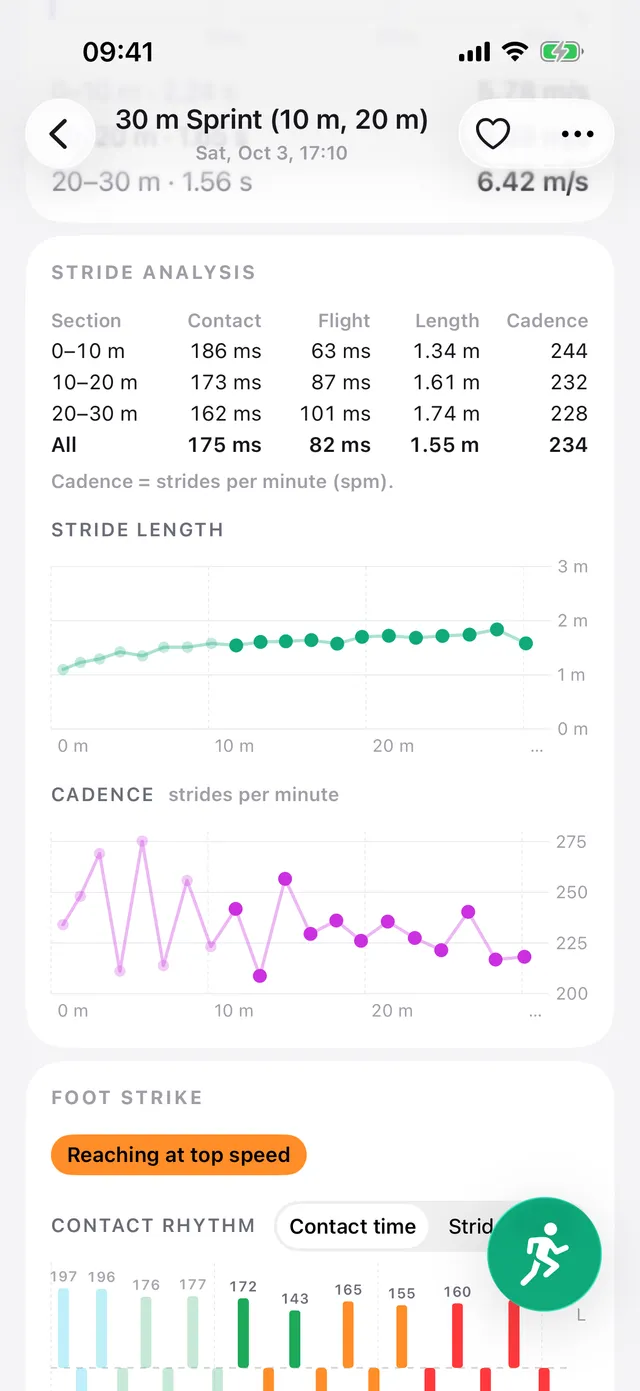
Agility tests that police themselves
Run the 5-0-5 (stationary or flying), 5-10-5 Pro Agility, T-Test, Modified T-Test, or Lane Agility, and Metric detects each turn and validates the line touch. Every rep comes with an instant replay, so a disputed test takes seconds to settle instead of a re-run. On the 5-0-5 you also get your change-of-direction deficit.
See agility analytics →Track every athlete across the season
Turn on repeat runs and the next run arms as soon as an athlete is back on the line, so the squad goes through back to back. With an Ultra coach plan, every result files itself against the right athlete. Rank on any split, agility time, or peak velocity, follow trends across the season, and let athletes see their own progress. Metric Ultra also brings in Metric Jump, Metric Lift, and the workout builder.
SEE COACH PLANS →How Metric Sprint works
Three short guides on setting up, the tests, and reading your results.
-
Recording a sprint
Where to stand the phone, camera height, and gate placement, ready in under a minute.
Read → -
Sprint & agility tests
Sprints from 5 to 30 m and all six agility tests: setup and how turns are verified.
Read → -
Reading your data
Personal bests, % of PB, split and velocity trends, history, and team leaderboards.
Read →
Leave the gates at home.
Try Metric Sprint today on your iPhone or iPad.

iOS